 Cascade Climate
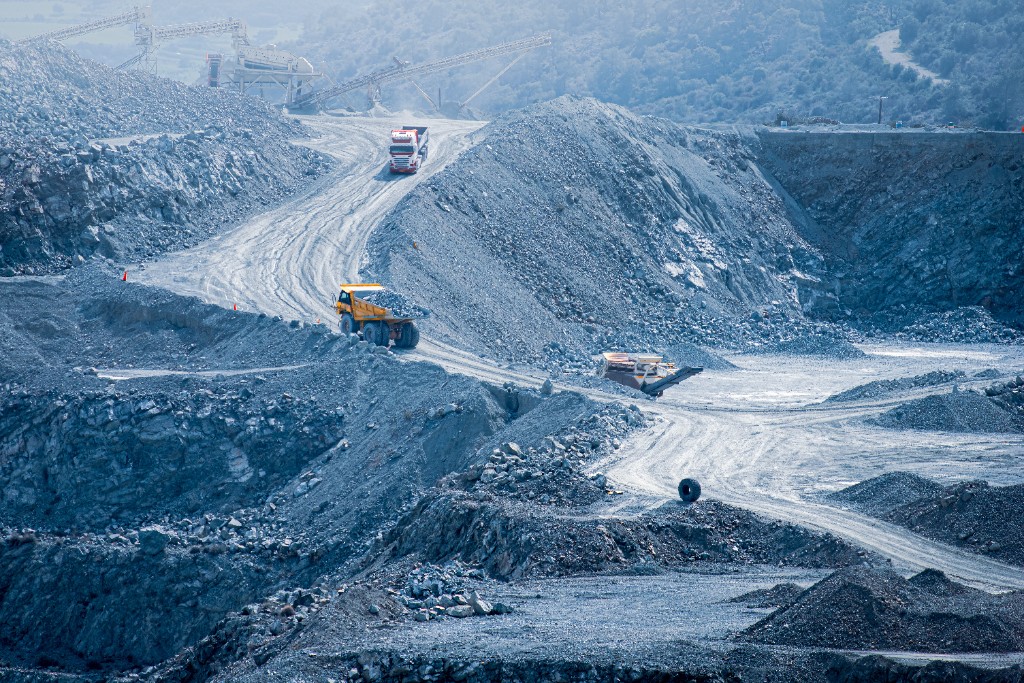
The ERW Data Quarry was built to make ERW data available to the research community. This investment is starting to take shape and reflect a broader range of ERW global deployments. Since May 2025, Carbon Drawdown Initiative, Flux, InPlanet, Mati, Silica, Varaha, and two academic long-term field stations studying ERW have shared datasets through the Data Quarry.
Today the Data Quarry hosts ten unique datasets, each representing a year or more of field projects across six countries and five continents. We encourage researchers to engage with this ERW deployment data through the Data Quarry's common access framework designed to unlock more commercial data that advances non-commercial ERW science.
What is in the Data Quarry today?
The collection currently includes ten datasets contributed by eight organizations across six countries:
Current Datasets
| Dataset contributor | Region | Crops and area (ha) | Dates uploaded | Years of data | Status |
|---|---|---|---|---|---|
| InPlanet Project Serra da Mantiqueira | Brazil | 1,010 ha Sugarcane | May 2025; October 2026 | 2 | Available upon request |
| Flux UNCCD Trial | Kenya | 124 ha Maize | May 2025 | 1 | Available upon request |
| Carbon Drawdown Initiative XXL Lysimeter | Germany | <1 ha | May 2025 | 1 | Publicly available |
| Mati Gaurella-Pendra-Marwahi Kharif 2024 | India | 620 ha Rice | March 2026 | 1 | Available upon request |
| InPlanet Project Araçari | Brazil | 358 ha Citrus | March 2026 | 1 | Available upon request |
| Carbon Drawdown Initiative 1200 t Secondary Clay Formation Research | Germany | 43 ha Mixed | March 2026 | 1 | Publicly available |
| Varaha Project Khargone | India | 195 ha Cotton and Wheat | New October 2026 | 1 | Available upon request |
| Silica Mata de Agua | Mexico | 23 ha Sugarcane | New October 2026 | 1 | Available upon request |
| University of California, Davis Sierra Foothill Research and Extension Center | USA | .4 ha Grass Clover Rangeland | New October 2026 | 1 | Available upon request |
| University of Illinois Energy Farm | USA | Corn | New October 2026 | 1 | Available upon request |
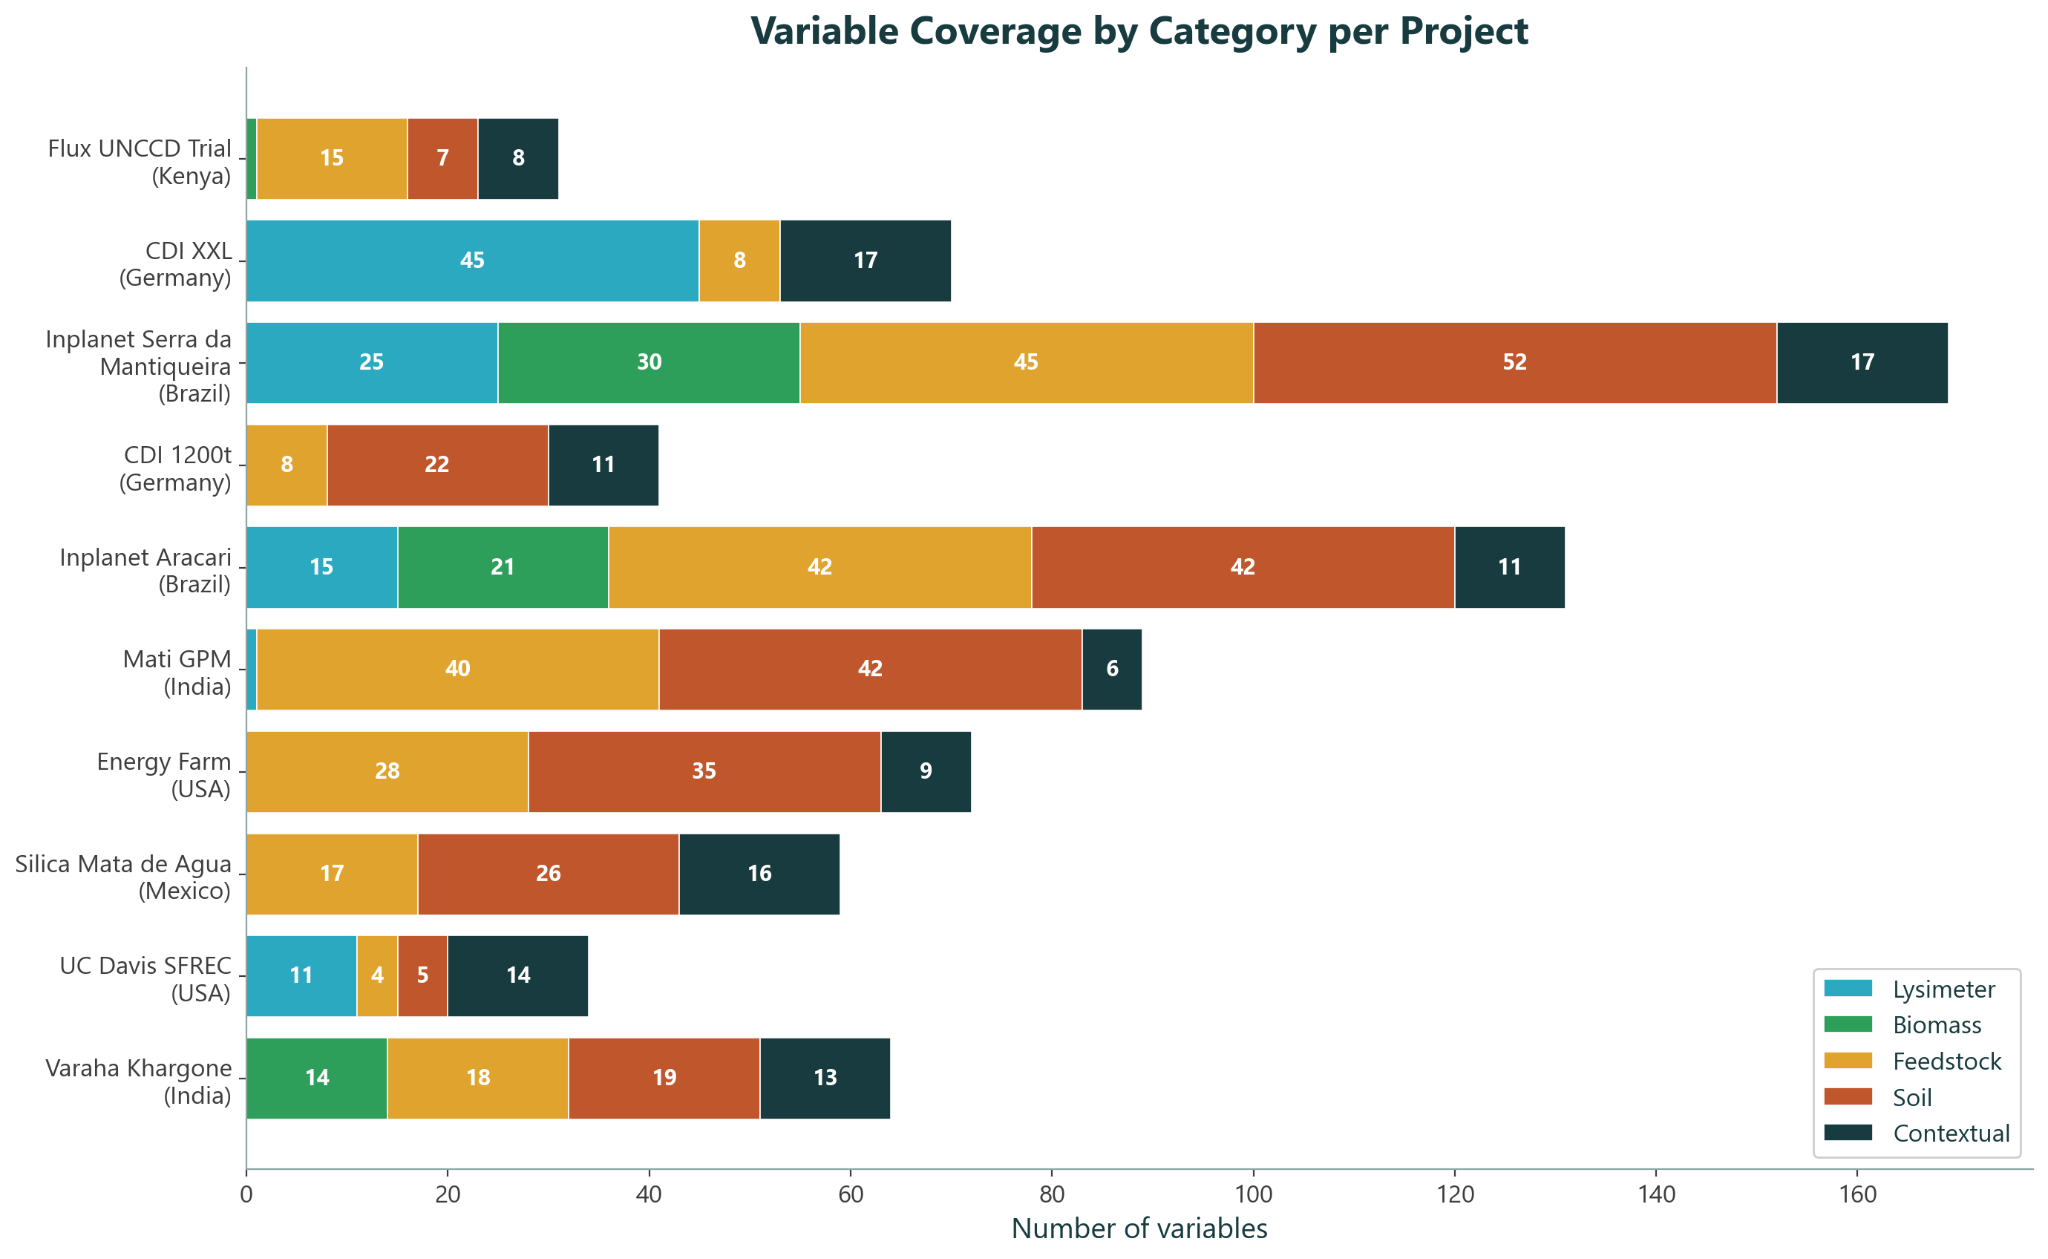
The datasets vary in scope and measurement coverage. Each contribution includes contextual data alongside measurements from five categories. Solid-phase soil measurements and feedstock characterization dominate the collection, reflecting where commercial MRV efforts are most concentrated today. We are hosting a growing, varied catalog of experimental, commercial, and academic datasets.
The commercial datasets give insight into how ERW is being actively deployed today. InPlanet's two Brazilian sites (Serra da Mantiqueira and Project Araçari) have the broadest variable coverage, spanning all five categories. The second year of Serra da Mantiqueira data is now hosted as well, with additional years coming soon. Mati, Varaha, and Flux have contributed data from especially data-sparse regions. Silica’s Mata de Agua uses a unique pyroclastic feedstock in a newly represented region for the Quarry.
The academic and experimental datasets investigate all aspects of ERW MRV. For example, the Carbon Drawdown Initiative's XXL Lysimeter project contributes rich lysimetry data, UC Davis’s SFREC experiment was designed to test a variety of MRV approaches, and the Energy Farm site offers data from repeated years of rock spread.
How much do the datasets overlap?
Breadth is only half the story. To do synthesis science — pooling datasets to reach conclusions that no single project can support — datasets need to measure the same variables.
Figure 2 shows how much the ten datasets overlap, both as a raw count of shared measurement tags and as Jaccard similarity (shared tags divided by combined tags).
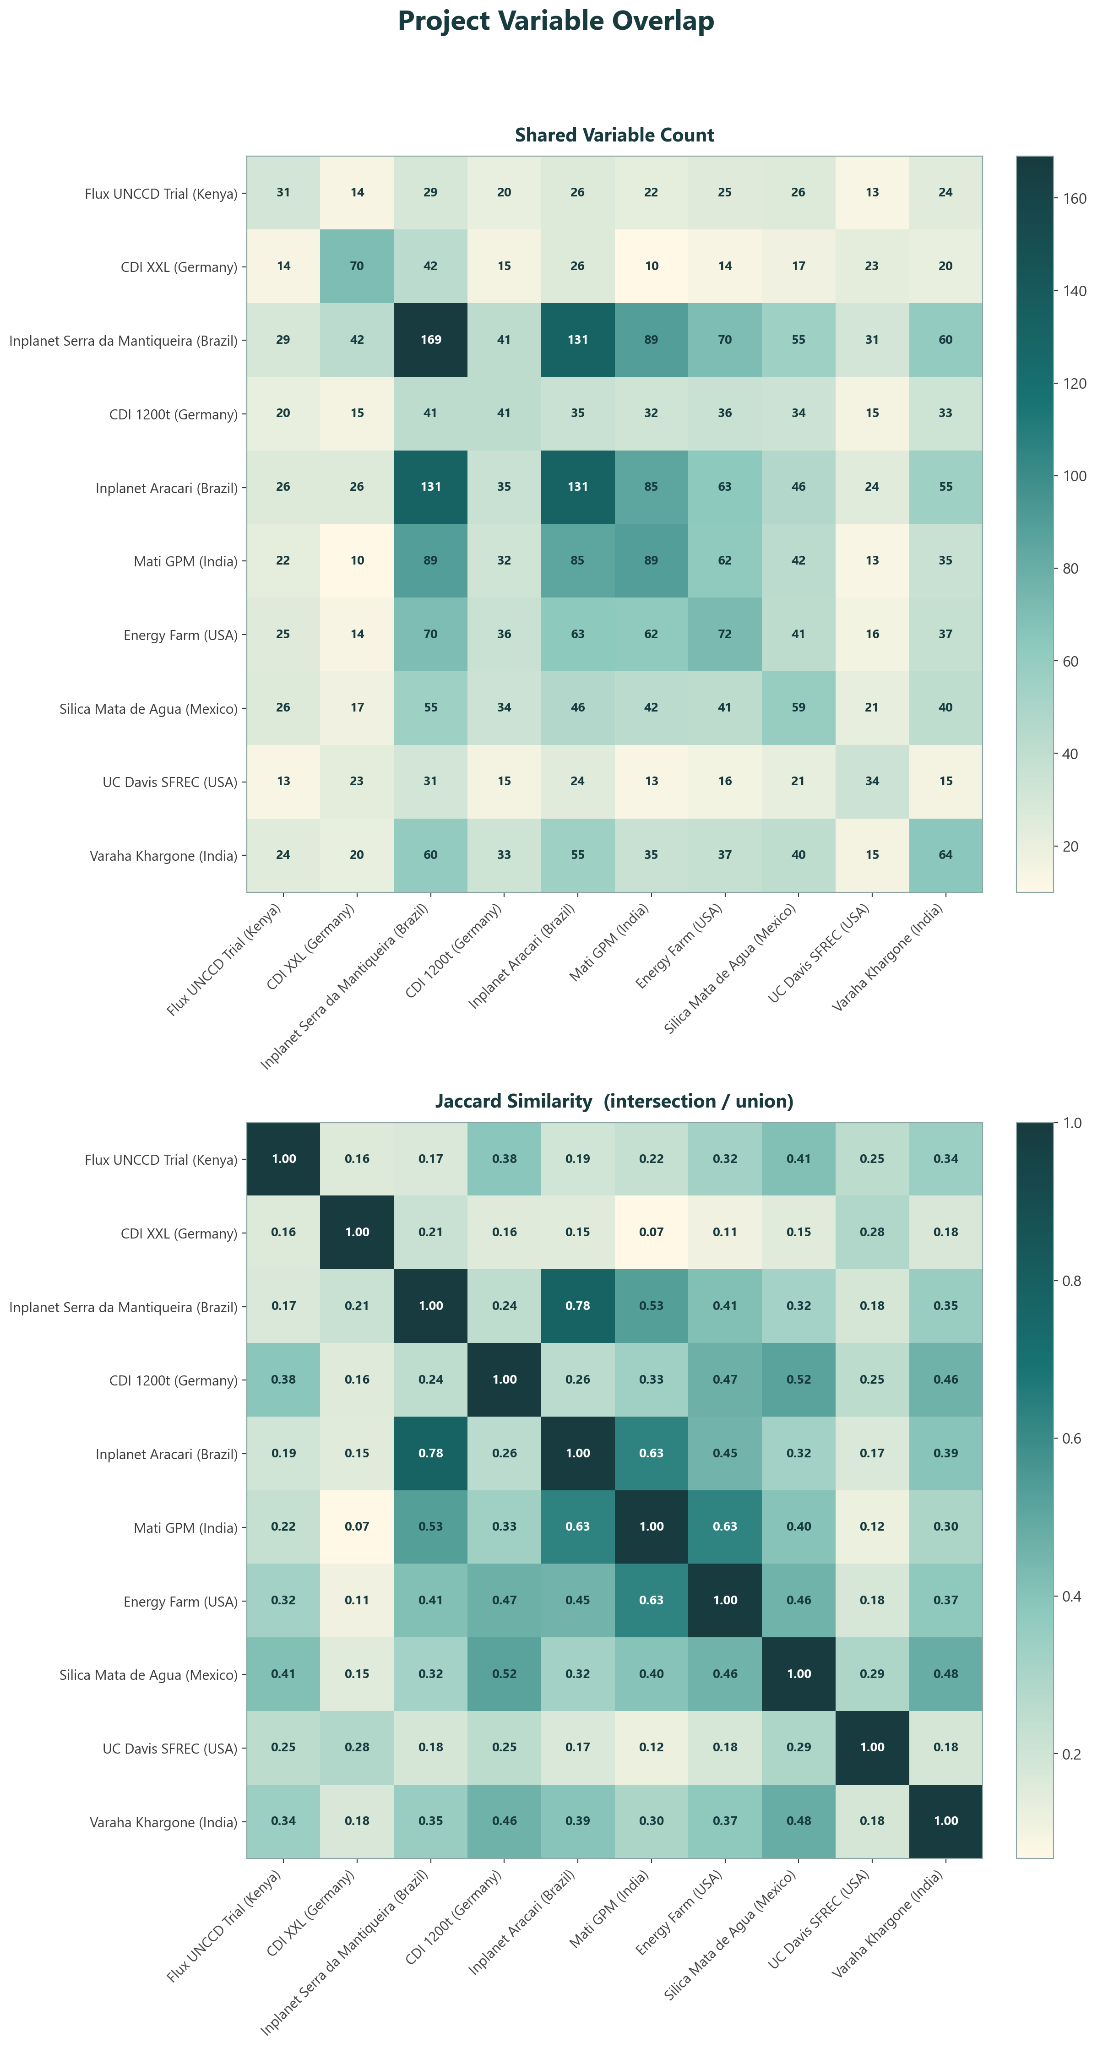
There's a clear pattern. Total tag counts are high, but overlap between projects is limited. The strongest overlap is between Serra da Mantiqueira and Project Araçari (Jaccard 0.78) — InPlanet's two sites, which share a common measurement protocol. Cross-developer overlap is more modest. This is the expected consequence of a field in which each company and study has built its own MRV approach — operating across a spectrum of agricultural soils and management practices — and it constrains how much synthesis science the current catalog can support.
What can the Data Quarry answer today?
When we launched the Data Quarry, we were especially interested in four questions that commercial data seemed well-positioned to inform:
- Dissolution rates: how and where does rock dissolve well?
- Time lags in MRV: what are CDR lags and what are true losses?
- Soil organic carbon (SOC): how does an ERW project affect SOC over time?
- Health and safety: how do ERW projects affect potentially toxic element accumulation in fields?
None of these questions can be fully answered by today's collection — but our catalog is growing more capable. Here's what the data shows today.
- Dissolution. This is where the catalog contributes most today. The datasets provide dissolution measurements from a broad, international sample. Seven datasets have immobile tracer data, enabling users to recompute dissolution themselves and test methodologies. Four datasets have multiple potential tracers to test across.
- Soil organic carbon. Resolving SOC dynamics will require denser and longer-term sampling than a single year of project data can provide. Currently seven datasets have SOC data (ranging from 18 to 323 SOC samples reported, with 155 SOC samples reported on average). As the depth and breadth of this data expand, so will our ability to interrogate SOC trajectories.
- MRV time lags. Most records are too short to investigate these questions directly, but the addition of Energy Farm (which has had repeated deployments over several years) and the second year of Serra da Mantiqueira allow users to start to test hypotheses directly. Our growing corpus of soil and lysimeter data is a great starting point.
- Potentially toxic elements. The current data show no evidence of regulatory violations in any of the projects in the Data Quarry. Foreclosing toxicity risks entirely, however, will require longer-term monitoring. All potentially toxic element data is made public and can be accessed at our channel on CDRXIV.
These challenges aren't shortcomings of the Data Quarry itself — they're the current shape of ERW field data. And showing that shape clearly is part of what the Quarry is for.
What's next for the Data Quarry?
The catalog will keep growing on two fronts. We will continue to onboard new datasets, with over 15 datasets in the queue, widening the range of soils, climates, and feedstocks represented. And we will continue ingesting the second year of data from several datasets already in the Quarry — the first step toward the longer time series that questions like time lags and SOC changes require.
NewERW Data Quarry: Forthcoming contributions↗
Do you have field data of your own to contribute? If you hold results from a commercial project or non-commercial ERW trial, we'd love to learn more. Please reach out to us at [email protected].