Introducing the Weathering Potential Explorer: A Global Screening Tool for Enhanced Rock Weathering Potential
Enhanced rock weathering (ERW) is an emerging carbon dioxide removal (CDR) strategy that accelerates the natural breakdown of alkaline rocks and minerals to capture and store atmospheric CO₂. While ERW builds on farmers' centuries-old practice of applying ground rock to improve soil pH and fertility, it's optimized specifically for carbon removal. We know ERW works, but we need better tools to understand where environmental conditions—particularly temperature, soil moisture, and pH—create the highest potential for rapid rock dissolution. That's why we built the Weathering Potential Explorer, an interactive global map that can support successful ERW deployments by pinpointing regions where relative environmental conditions could favor rapid silicate weathering.
Ready to explore global weathering potential? Jump straight to the tool or continue reading to learn more about how it works and how to use it effectively.
The following PDF is a practical guide to using the Weathering Potential Explorer. It explains what each button does, how to navigate the map, and what the different layers and filters will show. It also includes walkthroughs for key functions.
The following explainer (the rest of this page) details what the tool is for, how it works mechanistically, and its limitations.
Overview
Enhanced rock weathering (ERW) is an emerging carbon dioxide removal (CDR) strategy that accelerates the natural breakdown of alkaline rocks and minerals to capture and store atmospheric CO₂. Farmers around the world have long used finely ground rock like agricultural lime to adjust pH and improve soil fertility. ERW builds on these established practices but optimizes them for carbon removal on top of the existing benefits to soil and farming.
At the heart of ERW is a chemical reaction between rock particles and soil water. When reactive minerals dissolve, they consume acidity, release calcium and magnesium, and ultimately form bicarbonate ions or carbonate minerals to be transported to and locked away in rivers and oceans for long-term carbon storage. The speed of this weathering process (i.e., how quickly rocks dissolve) depends on several environmental factors, especially temperature, soil moisture, and soil water pH1. These factors determine how acidic, reactive, and mobile the soil solution is, and in turn, how effectively it can break down minerals.
1 The model underlying our Explorer Tool uses soil pH in H₂O, based on laboratory measurements from the SoilGrids dataset. This standard method involves mixing dried soil with deionized water and measuring the resulting slurry pH. While this is not a direct measure of in situ soil water pH, it serves as a globally available proxy for the acidity of surface soils and is commonly used in large-scale models to approximate the chemical conditions relevant to silicate weathering.
To visualize this, imagine a bucket of reactive rock powder submerged in water. If the water is warm and acidic, it will rapidly dissolve the rock, releasing cations that bind with dissolved CO₂. But if the water is cold, alkaline, or stagnant, the reactions slow down, and eventually reach equilibrium as the water becomes saturated. Real soils behave much like this bucket, but with added complexity: water moves, roots and microbes generate fresh acidity, and temperature shifts with the seasons. In dynamic soil environments, fast and sustained weathering depends on maintaining a flow of fresh, unsaturated water that can carry away weathering products and allow new CO₂ to be captured. In other words, in order to continue the reaction happening in the bucket, we must dump the water out and refill with fresh, unreacted water to start the process over, and warmer, slightly more acidic waters will speed up the reaction that happens.
Temperature, soil moisture, and soil water pH control how quickly weathering occurs. Temperature speeds up chemical reactions, moisture enables them by dissolving and transporting reactants, and pH influences both the rate at which minerals dissolve and how carbon is stored in solution. Importantly, these three variables are not independent of each other. Warmer climates, like the tropics, are often wetter, and wetter soils are often more acidic. As a result, by mapping where conditions are simultaneously warm, moist, and acidic, we can identify regions that are especially well-suited for ERW. Other factors like feedstock mineralogy, particle size, and local hydrology also influence carbon removal potential, but temperature, soil moisture, and soil water pH are the three most accessible and predictive variables available in global datasets.
While there are always local exceptions, this global pattern gives us a practical but powerful starting point for determining where ERW feedstocks have the highest potential to weather quickest. To help explore the variation of global weathering potential, we built the Weathering Potential Explorer, an interactive map that visualizes relative weathering potential across agricultural regions based on these three main inputs. We focused on weathering potential because, while they're just one piece of the ERW puzzle, they are also the crucial first step—we can’t quantify carbon removal without knowing how much rock has weathered.
Weathering Potential Explorer Capabilities
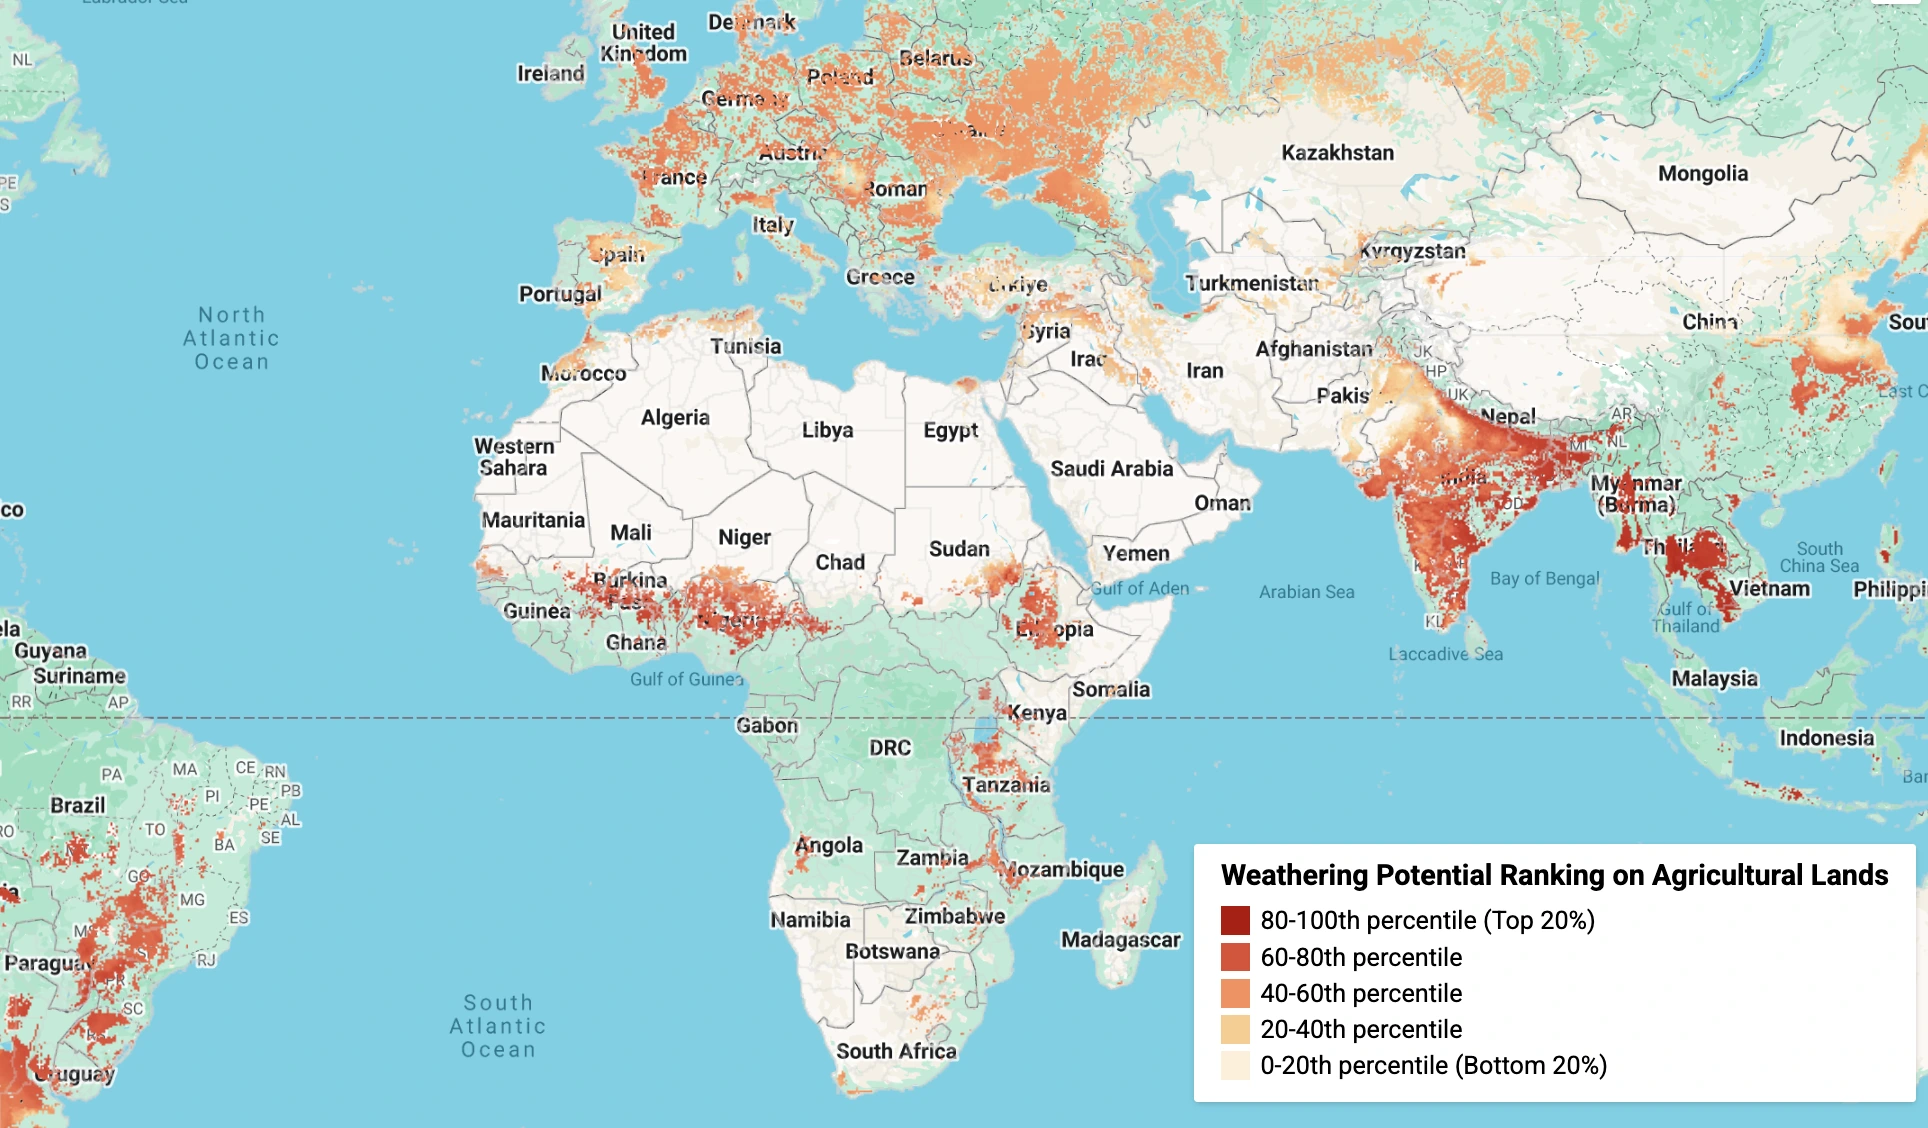
The Weathering Potential Explorer estimates where silicate weathering may hold the greatest potential, drawing on globally available datasets for land cover, temperature, soil organic carbon, soil moisture, and soil water pH. The tool outputs a normalized relative weathering potential index that returns percentile rankings across global agricultural soils, where the top percentiles indicate conditions more favorable to rapid rock dissolution. The Weathering Potential Explorer also offers cropland filtering and soil chemistry masks, and provides regional statistics for land area within each weathering potential range.
The calculation is based on a simplified formulation commonly used in weathering models, where dissolution rate is proportional to hydrogen ion concentration, soil moisture (representing how much rock surface is in contact with water, assuming that water is refreshed before reaching equilibrium), and a temperature-dependent Arrhenius factor (e.g., White & Brantley 2003; Maher & Chamberlain 2014). This captures key environmental drivers of weathering without modeling specific mineral kinetics.
Category
Capability
Tool’s Primary Output
Estimated relative weathering potential across global agricultural landscapes, expressed as a normalized index (0–1). This reflects the comparative speed of silicate weathering based on soil water pH, moisture, and temperature conditions. Data sources can all be found in Data Inputs and Spatial Resolutions.
Visual Output
Color-coded map: Light Tan (low) Dark Red (high) reflects relative weathering potential, where:
80-100th percentile (Top 20%) (Dark Red)
60-80th percentile (Red Orange)
40-60th percentile (Orange)
20-40th percentile (Light Orange)
0-20th percentile (Bottom 20%) (Light Tan)
Cropland Filtering
Users can apply land cover masks to limit the analysis to cropland areas. These datasets define cropland broadly as managed lands used primarily for the cultivation of food, fiber, and forage crops. While they effectively capture large-scale agriculture, they may miss smallholder farms and other mosaic systems. More detail can be found in Data Inputs and Spatial Resolutions.
Soil Chemistry Masks
Optional filters allow users to exclude: (1) extreme soil water pH values where weathering or carbon capture becomes less effective, and (2) areas with high soil organic carbon (user-inputed) where there is a larger risk of release of organic carbon to the atmosphere.
Regional Summaries
Clicking on any region opens a pop-up with land area statistics sorted by weathering potential categories, which the tool bins into five percentile ranges based on the normalized output. These summaries are shown for total land and cropland (if masked).
Limitations of the Weathering Potential Explorer
The Weathering Potential Explorer highlights promising regions for further investigation, but because it does not capture the full range of variables that ultimately determine where ERW can be most effective, it cannot provide definitive answers on site suitability or be used as a site selection tool.
Category
Limitation
Carbon Removal Estimates
The tool estimates relative weathering potential only. It does not calculate actual CO₂ removal, which depends on factors such as feedstock type, application rate, exposure time, and downstream transport of weathering products.
Agronomic Benefits
No modeling of pH modification, nutrient delivery, or crop yield impacts is included. These outcomes are highly site-specific and depend on local soils, crops, and management.
Economic Feasibility
The tool does not account for transport costs, grinding expenses, local infrastructure, or permitting and policy conditions.
Feedstock Availability
The calculations in this tool are most representative of common silicate minerals. However, there is no information on rock type, mineral composition, or proximity to quarries or mines as global feedstock availability is often not publicly available data. Users with access to local or proprietary feedstock data are encouraged to layer it onto the tool to support site-specific planning.
Hydrological Dynamics
Although the tool uses soil moisture as a proxy for water availability, it does not model hydrological processes such as leaching, runoff, or subsurface water flow that influence how dissolved carbon moves through the soil profile.
Cropping Systems
Crop type, root depth, seasonality, and land management practices are not represented in the tool.
Life Cycle Emissions
The tool does not account for upstream emissions (e.g., mining, grinding, transportation) or downstream impacts (e.g., secondary mineral formation, bicarbonate transport, re-emission under changing soil conditions).
Site-Specific Suitability
This is not a site selection tool. The core datasets used range from 250 m to ~1km in resolution and are harmonized to 1 km for analysis. As such, the Explorer is best suited for regional insights, not field-scale decisions. Users should treat anything smaller than ~1 km² (about 100 hectares) with caution and verify conditions through local measurements and higher-resolution data where available. More details on data resolutions can be found in Data Inputs and Spatial Resolutions.
Key Factors
Key factors that influence weathering potential
Enhanced rock weathering relies on the dissolution of minerals in soil environments. However, not all minerals dissolve equally fast, and not all environments promote the same reaction rates. While a range of rock types can be used in enhanced weathering, this tool models silicate mineral dissolution only. Other materials, such as carbonates or other fast-weathering minerals like wollastonite, may also be relevant in some contexts, but their reaction kinetics differ significantly, with lower activation energies and different temperature sensitivities than the silicates modeled here.
Several environmental factors influence how quickly silicates weather. The Weathering Potential Explorer models three of the most important and available variables: temperature, soil moisture, and soil pH. Warmer conditions accelerate reaction kinetics; soil acidity promotes dissolution, but excessive acidity limits the ability of soils to retain bicarbonate, so conditions of mild acidity are optimal for ERW; and soil moisture provides the solvent in which dissolution reactions occur. While these variables interact in complex ways, they offer a strong first-pass estimate of where weathering is likely to proceed more rapidly.
Other factors like mineralogy, particle size, and water flow dynamics also shape real-world weathering potential, but are held constant in this model because “weathering potential” here refers to a unitless, relative reaction rate per unit of reactive surface area, normalized across all land pixels2. In practice, the model assumes an average activation energy representative of common silicate feedstocks like basalt3. It does not account for application rate, surface area distribution, or actual CO₂ uptake.
The result is a dimensionless index of relative weathering reactivity—a measure of how favorable local conditions are for silicate weathering, all else equal. This is not a prediction of carbon removal flux, but rather a screening tool to highlight where environmental conditions may support faster dissolution and, in turn, more effective silicate ERW deployments.
2 In this formulation, particle size and application rate do not affect results directly, while mineralogy could alter outcomes via the assumed activation energy, and water flow dynamics could influence whether the far-from-equilibrium assumption holds.
3 The model assumes a constant activation energy of 68.8 kJ/mol, representative of common silicate minerals such as basaltic glass or amorphous silica (White and Blum, 1995). This simplifies mineral-specific variability while preserving broad sensitivity to temperature-driven weathering rates. For a deeper discussion of how activation energies influence mineral dissolution across environments, see (Brantley et al., 2024).
While full carbon accounting must also consider downstream processes and uncertainties, weathering potential is the first gating variable and is one of the few variables we can actively optimize through geographic targeting and deployment strategy.
To dig deeper into how temperature, soil moisture, and pH influence silicate weathering, the subsections below provide more detailed explanations of each variable and its role in the ERW model.
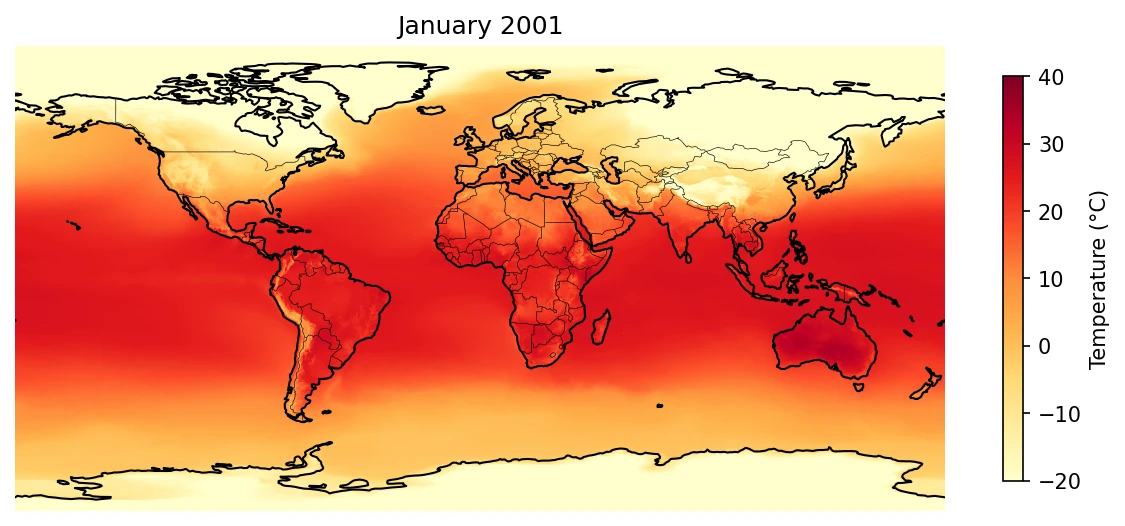
Temperature
Temperature is one of the most powerful drivers of silicate weathering. If you’ve ever stirred sugar into hot tea and watched it dissolve almost instantly, you’ve seen the basic principle in action: chemical reactions tend to accelerate with heat. The same is true for silicates in soil—warmer conditions accelerate the breakdown of reactive rock, which in turn drives faster carbon dioxide removal.
This behavior is described by the Arrhenius equation, a foundational concept in chemistry. It links temperature to reaction rate through a parameter called activation energy, which reflects how much energy is needed to kickstart the reaction. Silicates have relatively high activation energies, meaning they’re especially sensitive to changes in temperature. As the temperature increases, the rate of weathering doesn’t just rise steadily; it rises exponentially.
This has important geographic implications. For example, a soil at 30°C (common in parts of central Kenya) can weather some types of silicates roughly five times faster than a cooler soil at 10°C (such as in Scotland), all else equal. While temperature is only one part of the ERW equation, it’s often a major advantage in tropical regions where heat accelerates the reaction from the start.
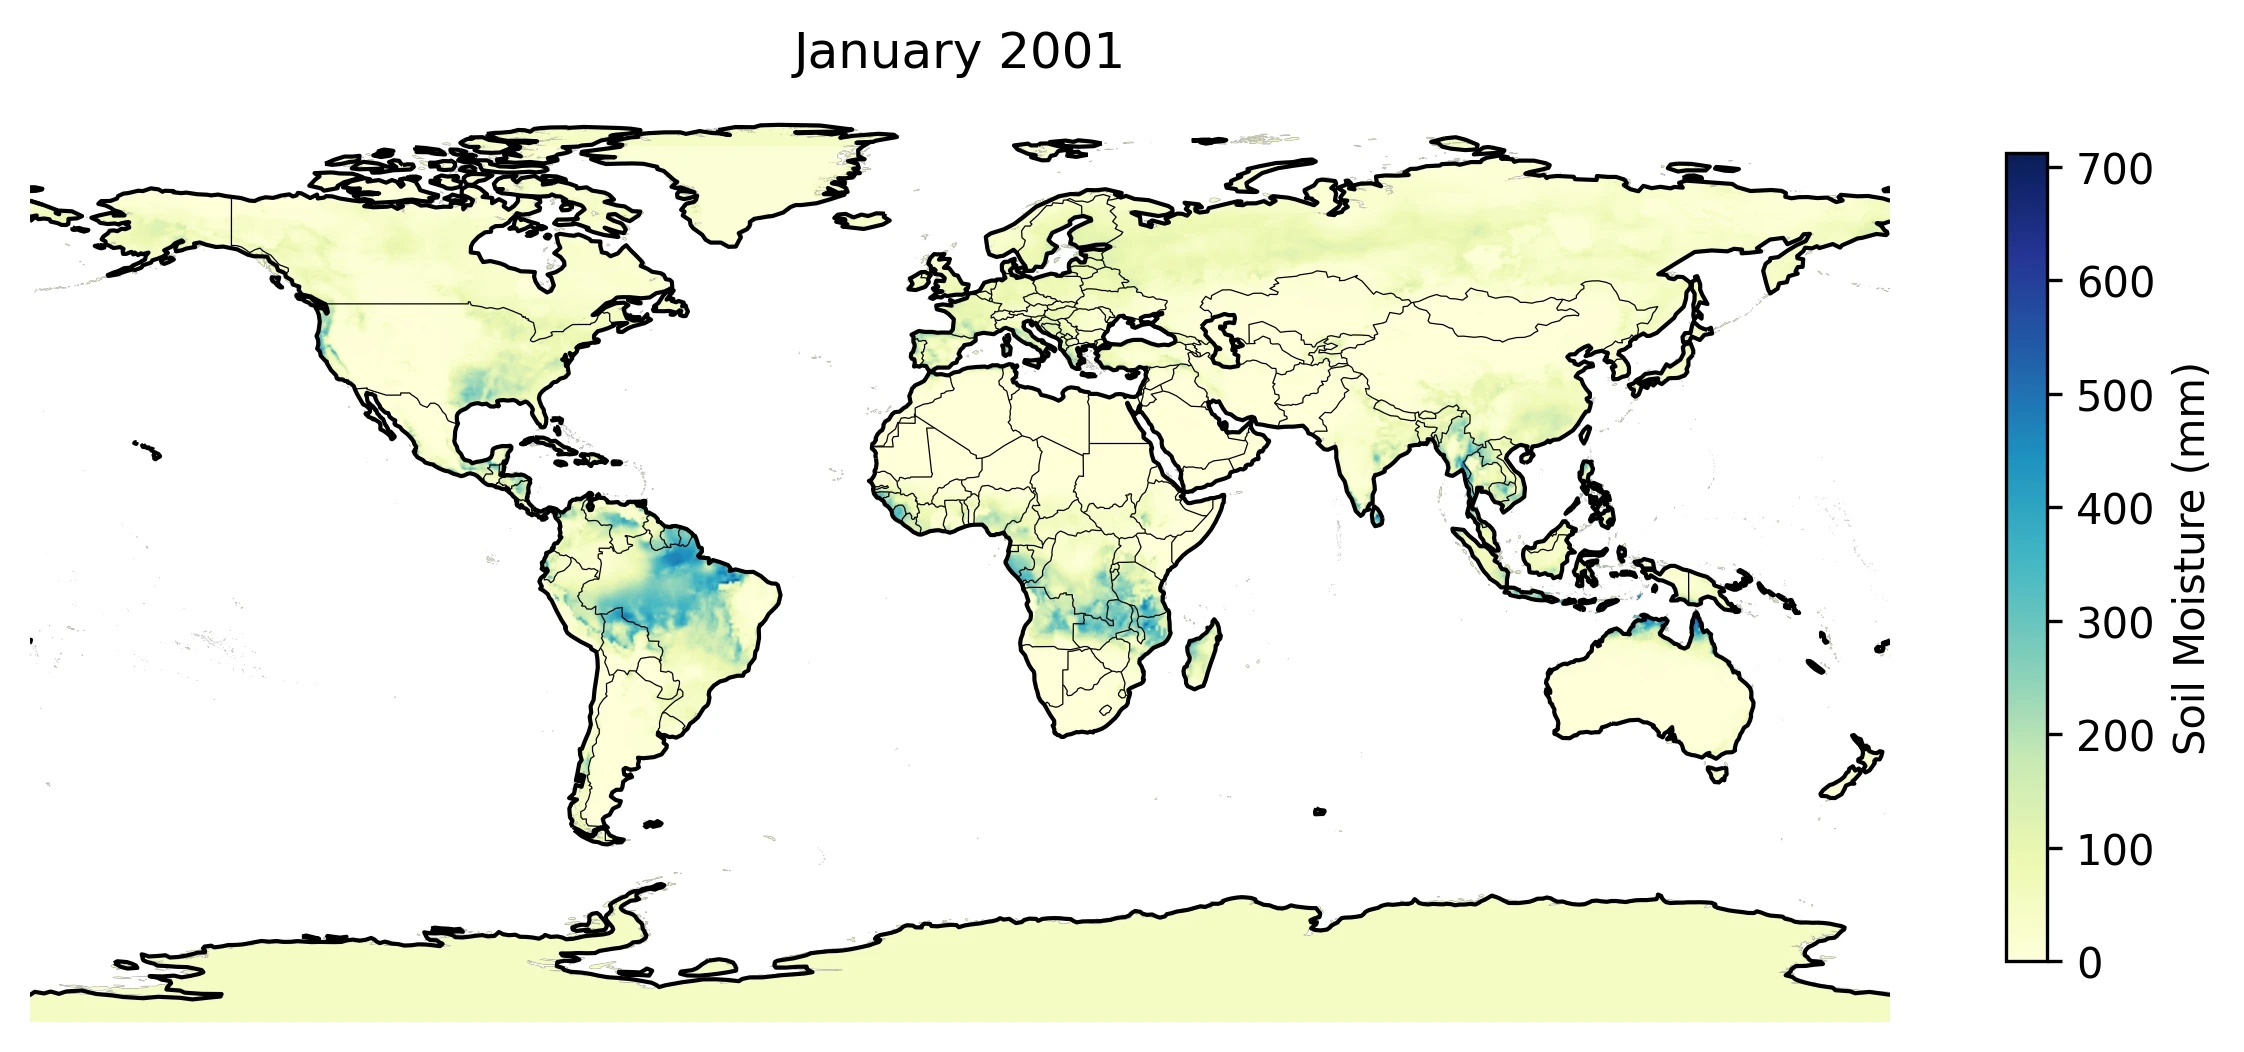
Moisture
While temperature accelerates weathering, water enables it. Moisture is the medium through which CO₂ and minerals dissolve and react. It facilitates both the chemical breakdown of silicates and the transport of dissolved bicarbonate and cations out of the system.
In the Weathering Potential Explorer, we use annual mean soil moisture as a practical proxy for water availability in the root zone. While it doesn’t represent water movement directly, it helps identify soils that regularly receive water (whether from rainfall or irrigation) and that can retain it long enough to support weathering. This degree of water–rock interaction governs how readily reactants can reach mineral surfaces and where products could be carried away.
Higher average soil moisture often indicates environments where unsaturated water is present, which is essential for mineral dissolution and bicarbonate formation. But, it's not just the presence of water that matters—it’s how often that water is replaced. If water in the soil becomes saturated with dissolved elements, weathering slows or stops. To keep reactions going, the system needs a constant supply of fresh reactants (like H⁺ and CO₂) and a way to remove reaction products (like silicon and base cations). This dynamic is what keeps the chemical gradients steep and the weathering process active.
Think of soil like a sponge. If you’ve been using the sponge for a while without rinsing it, the dirty sponge will not be able to remove gunk off the plate you’re washing, much like soil water that has not been replaced. If the sponge is regularly squeezed and re-wetted, the fresh water and soap will clean your plate more efficiently. In soils, rainfall or irrigation and the resulting infiltration ‘resets’ the water chemistry like rinsing a sponge. This repeated turnover keeps reactions going.
In silicate weathering models, when the rate of infiltration and soil water replacement is greater than the rate that minerals dissolve, the chemical state of the soil water is referred to as “far-from-equilibrium”, a condition where the soil water hasn’t yet saturated with dissolved rock elements and dissolution continues at near-maximal rates. In the Weathering Potential Explorer, we assume that these reactions are happening “far-from-equilibrium”. This assumption is important because the activation energy used in our model (68.8 kJ/mol) is based on lab and field experiments conducted under these conditions.4
4 Brantley, S. L. (2024). Toward a unified theory of chemical weathering. Science.
5 In most likely ERW settings, especially agricultural areas, high soil moisture often coincides with regular precipitation and infiltration, which can help refresh porewater and maintain conditions far from equilibrium. But in low-drainage environments like wetlands or tundra, soils can remain saturated without much flushing, which may limit weathering despite high moisture.
However, we don't model water infiltration, transport, or residence time in the Weathering Potential Explorer. While we assume soils with high average soil moisture will experience a “far-from-equilibrium” weathering regime, we note that this is not always true. Soils could have high moisture because the “sponge” is not regularly “squeezed”, which would lead to this tool overestimating the ERW potential for some sites.5
This is a simplification, but it reflects standard practice in global-scale weathering models, which must balance physical realism with data availability. Users should interpret moisture-driven variation as a broad indicator of hydrologic suitability, and not a substitute for site-specific assessments of drainage, infiltration, or water residence time.
Soil pH
Soil pH plays a critical role in silicate weathering and in determining whether ERW actually results in long-term carbon removal. Lower pH increases the availability of protons (H⁺), which accelerate the breakdown of silicates and release base cations like calcium and magnesium. These cations can then react with dissolved CO₂ to form bicarbonate, which may be transported to downstream reservoirs and stored for millennia.
But more acidic doesn’t always mean more effective. In overly acidic soils, several dynamics can interfere with durable carbon sequestration. While weathering still occurs, the dissolved products may not form stable bicarbonate or carbonate compounds immediately at the weathering site. Instead, they may be transported elsewhere or may re-equilibrate with atmospheric CO₂. Today’s MRV systems place heavy emphasis on local fluxes, which are more easily measured, while downstream fate remains uncertain.6
6 While all acid neutralization removes CO₂ in principle, most MRV protocols credit only storage that is quantifiable and stable, usually requiring site-level measurements of bicarbonate formation or modeled long-term fate.
Note: Measured soil pH reflects not only local hydroclimate and underlying geology, but also land use and management history. Agricultural fields, for example, are often limed to raise pH or acidified by fertilizers.
At high pH (above ~8), weathering potential slows significantly, and carbon is more likely to be stored in solid carbonate minerals, which can redissolve later and are harder to account for reliably.7 Thus, there’s a sweet spot for weathering-based carbon removal, which is typically in soils with a pH between about 5.5 and 7—a range that also happens to be agronomically favorable for most crops, supporting nutrient availability and root health.8
This trade-off is illustrated in the figure below, based on representative soil chemistry conditions. The exact curve may vary depending on soil pCO₂, total alkalinity, and other carbonate system parameters.9
7 Brantley, S. L. (2024). Toward a unified theory of chemical weathering. Science.
8 USDA Natural Resources Conservation Service (NRCS). Soil pH: What It Means. Pennsylvania Envirothon. [PDF]
9 For detailed modeling of pH–weathering–carbon dynamics, including the role of soil pCO₂ and carbonate equilibria, see Dietzen, B. & Rosing, M. (2023).
Figure 1. Conceptual trade-off between relative weathering rate and relative carbon capture efficiency as a function of soil pH. Highly acidic soils tend to promote fast mineral dissolution but may limit stable carbon storage, while alkaline soils slow weathering and favor carbonate precipitation with uncertain permanence. The optimal range for ERW typically lies between pH ~5.5 and 7, where both reactivity and durability are reasonably balanced.This curve is illustrative and based on characteristic soil conditions. The exact shape will vary with factors such as soil pCO₂, alkalinity, and total carbonate system buffering.(Adapted from
Bertagni & Porporato 2022;
Dietzen & Rosing 2023;
Levy et al. 2024.)
The Weathering Potential Explorer includes an optional pH filter that allows users to exclude soils outside of a user-specified range (with 4.5–8 as the default range). These are regions where weathering is either too slow or is less likely to lead to durable carbon storage under current MRV frameworks.
The tool also offers a separate filter to exclude soils with high soil organic carbon (SOC) percentages. These regions often have abundant organic acids that can bind with cations like Ca²⁺ and Mg²⁺, reducing their ability to form stable bicarbonate. While these acid effects are reflected in the pH layer, the SOC mask provides an additional screen for areas where carbon removal efficiency may be suppressed.
Soils with both low pH and high SOC may be high-risk zones for ERW deployment. In Foundations for Carbon Dioxide Removal Quantification in ERW Deployments, SOC >5% soils are flagged as areas with substantial risk of SOC loss under amendment. Users should carefully consider both geochemical and biological context when evaluating these regions.
Available Land
Even under ideal weathering conditions, ERW is only viable where the land itself supports deployment. That means exposed soils, equipment access, and systems where applying rock powder is logistically and agronomically feasible. To date, the vast majority of field trials and commercial efforts have focused on cropland, where several enabling factors converge: soils are regularly amended, application equipment already exists, and there's a long-standing precedent for interventions like agricultural liming.
The Weathering Potential Explorer centers on this logic by offering two optional cropland masks (ESA WorldCover (10 m) and GFSAD1000 (1 km)) to help users restrict analysis to actively managed agricultural areas. These filters narrow the focus to lands where ERW is most likely to be operationally viable and beneficial from a co-management perspective.
Different croplands may vary widely in their suitability based on farming practices, infrastructure, or microclimate. And in some regions—particularly in the tropics—land cover maps may miss smallholder mosaics or mixed-use fields. The Explorer does not currently support user-added land filters, but advanced users can apply their own masks externally using GIS tools or by modifying the code in Google Earth Engine. If you are interested in accessing our source code, please contact arielle[at]cascadeclimate.org
Relative Weathering Potential Estimation
The Weathering Potential Explorer calculates a relative weathering potential based on a simplified expression drawn from geochemical kinetics, specifically building on the normalized weathering flux potential framework developed by Bertagni and Porporato (2022). The underlying idea is that weathering speed is influenced by three key environmental factors:
Soil moisture (s) – representing the availability of water to facilitate reactions
Proton concentration ([H⁺]) – derived from pH, which drives acid-promoted dissolution
Temperature (T) – which accelerates reaction kinetics via the Arrhenius equation
The core relationship follows the form:
Where:
r is the relative weathering potential
s is a dimensionless soil moisture proxy
[H+] is the proton concentration, calculated from the pH input as 10-pH
T is absolute temperature in Kelvin
A is a pre-exponential constant (absorbed in normalization)
Ea is activation energy (68.8 kJ/mol in our model)
R is the universal gas constant
It’s important to note that this model estimates a relative weathering index, not an absolute weathering flux (i.e., mass of rock dissolved or carbon removed over time and space). The values are normalized across all land pixels, allowing for comparison between regions, but not for carbon removal quantification without additional assumptions.
Also note that this model assumes static environmental inputs, including pH. However, in reality, the application of alkaline rock can rapidly increase soil pH, sometimes within the first few weeks or months after spreading. This creates a feedback: while weathering initially proceeds quickly in acidic soils, the reaction itself tends to raise pH, which in turn slows further dissolution. As a result, the modeled weathering potentials are best interpreted as upper bounds that are most accurate in the early stages of rock application or at low doses. Long-term weathering trajectories are likely to differ as soil chemistry evolves.10 Similarly, soil moisture and temperature may be impacted by ERW deployments.
The Weathering Potential Explorer is designed as a global screening tool to support early-stage prioritization of where weathering may be quickest. It offers directional insights, not deployment prescriptions. Many of the core limitations were introduced earlier in this explainer (see Limitations of the Weathering Potential Explorer
), but we expand on several key modeling assumptions and constraints here.
Resolution and Scale
The map operates at a resolution of approximately 1 km² per grid cell, or about 100 hectares. This is consistent with many global-scale land surface models and biogeochemical tools such as WorldClim, SoilGrids, and TerraClimate. This supports macro-scale targeting, but masks local variation. Promising micro-regions may not appear in the analysis, just as small mafic rock sources may be overlooked in coarse global geology layers. Users should treat the tool as a way to narrow the search, not to make site-level decisions. Field-scale baselining and operational considerations remains essential.
Temporal Resolution
The tool uses long-term annual averages for environmental variables, which smooth out seasonal dynamics and ignore interannual variability. More information about the datasets and resolutions can be found in Data Inputs and Spatial Resolutions. While this makes global comparisons tractable, it may obscure short-term constraints or opportunities, such as monsoonal cycles or temporary droughts that influence when and how ERW can be applied.
Feedstock Assumptions
The model does not incorporate any information about feedstock properties, including amount applied, grain size, or mineral composition. All outputs are normalized to reflect a relative weathering potential per unit of reactive surface area under environmental conditions. That means variables like grain size or application rate do not influence the outputs directly, but would be required to translate the relative rate into a carbon removal flux.
To represent broad mineral weathering behavior, the model assumes a fixed activation energy (68.8 kJ/mol), consistent with fast-weathering silicate feedstocks like basaltic glass. In reality, this parameter and overall reactivity varies with feedstock mineralogy, particle size, and surface coatings. These factors are critical for downstream carbon accounting but are held constant in this simplified model.
Land Use Classification
Cropland filters in the Explorer rely on datasets which are reliable at global scale but may miss smallholder systems or mosaic landscapes, especially in the tropics. These limitations are especially relevant for identifying ERW potential in places where farming systems are less intensively mapped. Users should interpret cropland masks as indicative, not definitive.
No Carbon Flux Estimation
The tool does not estimate CO₂ removal, even indirectly. Its output reflects comparative weathering reactivity, not carbon stored or creditable under MRV frameworks. Translating weathering potential into carbon flux requires additional assumptions about feedstock supply, application logistics, monitoring protocols, and downstream carbonate stability, all of which lie outside the scope of this tool.
Beyond the Model: Practical and Economic Context
Successful ERW deployment depends on economic, logistical, and operational factors that vary widely from place to place and are not reflected in the Weathering Potential Explorer. For this reason, this tool is not a substitute for holistic planning at the site level.
In most cases, it is the economic and operational conditions, rather than weathering potential alone, that determine whether ERW is viable, fundable, and capable of delivering real-world impact.
One important consideration is proximity tosuitable feedstocks. Most ERW projects today rely on mining byproducts, such as crushed basalt from aggregate production, rather than sourcing new rock solely for carbon removal. This approach minimizes environmental impact and leverages existing supply chains. Still, these materials are unevenly distributed. Large bodies of mafic and ultramafic rocks, including basalt and dunite (an olivine-rich rock), are geologically constrained to certain regions. Projects located near these formations and near active mines benefit from lower transportation costs, reduced emissions, and easier access to materials. Identifying optimal deployment zones requires balancing favorable weathering conditions with practical access to rock.
Infrastructure also matters. ERW requires not just proximity to rock sources, but also access to low-emission transport, grinding and spreading equipment, and sometimes laboratory capacity for monitoring. While tropical regions often offer favorable weathering conditions, infrastructure is often more developed in countries with greater industrial capacity and logistical access. This greatly influences where ERW can scale most cost-effectively. To estimate the costs of rock, hauling, and spreading (RHS) and measurement, reporting, and verification (MRV) for small-scale deployments, see the ERW MRV Cost Estimator and Database.
Energy and labor costs play a role as well. In parts of the Global South, lower costs may support deployment at scale, while in other regions, cleaner electricity grids may reduce lifecycle emissions during rock processing. These tradeoffs vary significantly by location and must be weighed against durability and monitoring needs.
Finally, there is also growing interest in the agronomic benefits of ERW, especially in areas with acidic soils and low agricultural productivity. In these settings, ERW may help improve soil pH, enhance nutrient availability, and boost yields, offering local value beyond carbon. These benefits are particularly important in smallholder systems where agriculture is central to livelihoods and where large yield gaps remain. However, more research is needed to identify which crops and systems are most responsive to better quantify the local value of ERW.
OpenLandMap was selected for its global availability and consistency with GEE. While local datasets may offer finer resolution in some regions, OpenLandMap provides a harmonized global baseline for exploratory screening.
OpenLandMap provides categorical classes (e.g., sandy loam, clay) at 1 km resolution, derived from harmonized soil profile data and machine learning models. While not directly used in the weathering potential calculation, this layer is useful for exploratory analysis, as texture can influence both soil moisture retention and reactive surface contact time.
We use mean annual air temperature from GSHTD v1.0, which provides daily temperature estimates at 1 km resolution from 2001 to 2020. To reduce interannual noise and match the climatological scale of other inputs, we calculate the mean annual temperature across this full 20-year period.
The GSSM1km dataset provides daily surface soil moisture (0–5 cm) at 1 km spatial resolution from 2000 to 2020. To align with the temporal scale of the other model inputs, we computed the mean annual value for each year and then averaged across all 21 years to produce a stable, globally consistent baseline.
ESA WorldCover offers fine-scale land cover mapping, while GFSAD allows filtering for specific cropland types (e.g., irrigated, rainfed), making them complementary for mask-based queries.
These standardized boundary datasets support region-based summaries and allow users to explore ERW potential at both national and subnational levels.
Analysis Scale
N/A
1km
To ensure consistency across datasets and efficient processing within Google Earth Engine, we resample all layers to a common working resolution of 1 km. This enables global coverage and comparability but means that local heterogeneity—such as microclimates, farm-scale variations, or nearby feedstock sources—is not captured.
Conclusion
The Weathering Potential Explorer is the first global tool to map environmental suitability for ERW deployment. By combining publicly available datasets with a simplified mechanistic model, it helps identify regions where environmental conditions may be most conducive to effective weathering. This tool is only a directional guide and its outputs should be interpreted in context and paired with local knowledge, ground-truthing, and further baseline analyses. As momentum builds around ERW as a climate solution, we believe open-access tools like this can support private and public sector decision making to unlock the full potential of ERW.
Credits
Development of the Weathering Potential Explorer was led by Arielle Lok, building on the foundation of Abigail Fitzgibbon’s senior thesis at SciencesPo. Abigail’s research informed the model design, variable selection, and framing of the tool. Arielle developed the web application and authored the documentation with adapted portions of Abigail’s thesis text. Abigail also created the charts and animations used in the explainer.
We offer special gratitude to
Tyler Kukla for major scientific feedback and model refinement,
Benjamin Möller for technical review,
Seth Whiteaker for guidance on mapping best practices, and Xiao Xiao Long for website development support. Additional thanks to members of the Cascade Climate team who took the time to proofread and test the tool internally.
If you identify any errors or have suggested updates to the web app or accompanying documentation, please contact arielle[at]cascadeclimate.org.
![r ∝ s[H+] Ae-Ea/(RT)](/_app/immutable/assets/explorer-eq.Bbg27Lbm.webp)